Understanding New Georgia Milestones Assessments
This morning, the Georgia Department of Education released the results of the first-ever administration of the Georgia Milestones assessments based on the new Georgia Standards of Excellence. I am sure many educators, students, parents and stakeholders have questions and are seeking clarification for what all of this means for the state and Atlanta Public Schools.
After seeing achievement levels on the Georgia Milestones, I needed a
lesson from our Accountability Office on how to make sense of the tests (Criterion-Referenced Competency Tests and End-of-Course Test) that were
previously administered across Georgia prior to 2015 and how they relate to the new Georgia Milestones assessment. OMGosh!
So, I started with what State School Superintendent Richard Woods explained in September:
These results show a lower level of student proficiency than Georgians are used to seeing, but that does not mean Georgia students know less or that teachers are not doing a great job – it means they’ve been asked to clear a higher bar. Our previous assessment, the CRCT, set some of the lowest expectations for student proficiency in the nation, and that cannot continue.
Superintendent Woods goes on to explain that Georgia Milestones was designed to “even the playing field with the rest of the nation” and that is essential if our students are to remain competitive for national jobs in the future.
The Changes
So how is Georgia Milestones different? A major change comes with Georgia Milestones assessing student learning across four levels of performance, instead of just three with the CRCT. The Milestones achievement levels are Beginning Learner, Developing Learner, Proficient Learner and Distinguished Learner. The state thoroughly explains the differences here.
APS Scores
How did APS students do?
To explain, we see these scores as creating a new baseline for APS performance. We need to be clear that Georgia Milestones and the CRCT are two different tests, with different expectations set for student achievement and, thus, not directly comparable. Because the expectations set by the Georgia Milestones system are higher, it was expected that the percentage of students considered proficient would initially be lower.
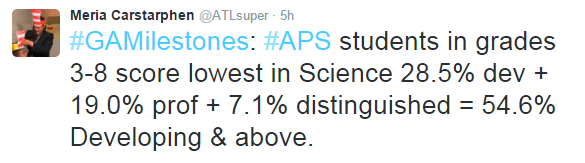
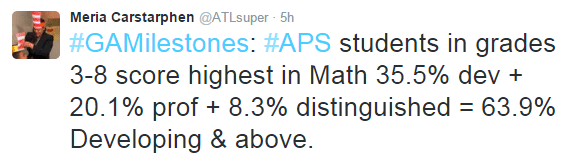
The results released today show our elementary and middle school students scored highest in Mathematics (with 63.9 percent at Developing or above) and lowest in Science (with 54.6 percent). The same report shows that APS students scored highest in Ninth-Grade Literature and Composition (70.5 percent) and lowest in Physical Science (34.2 percent). But it should be noted that the number of students taking these assessments varied widely with only 774 taking Physical Science, compared to 3,579 students taking Biology.
The charts below and our press release provide more detail. Our Data and Information Group continues to evaluate the scores so we can redirect resources, provide additional supports and remediation as necessary. We provide more results at www.atlantapublicschools.us/milestones.
Table 1: APS 2014-2015 Georgia Milestones Results, Average of Grades 3-8
| Beginning Learner | Developing Learner | Proficient Learner | Distinguished Learner | Developing and Above | |
| English Language Arts | 38.4% | 29.4% | 23.6% | 8.6% | 61.6% |
| Mathematics | 36.1% | 35.5% | 20.1% | 8.3% | 63.9% |
| Science | 45.4% | 28.5% | 19.0% | 7.1% | 54.6% |
| Social Studies | 39.3% | 33.9% | 16.4% | 10.3% | 60.7% |
Table 2: APS 2014-2015 Georgia Milestones End-of-Course Results by Subject
| Beginning
Learner |
Developing
Learner |
Proficient
Learner |
Distinguished
Learner |
Developing and Above | |
| American Literature and Composition | 30.7% | 40.4% | 23.5% | 5.4% | 69.3% |
| Analytic Geometry | 45.4% | 33.0% | 17.7% | 4.0% | 54.6% |
| Biology | 54.0% | 21.7% | 19.0% | 5.3% | 46.0% |
| Coordinate Algebra | 42.1% | 33.4% | 19.1% | 5.4% | 57.9% |
| Economics/Business | 40.7% | 33.1% | 22.8% | 3.5% | 59.3% |
| Ninth Grade Literature and Composition | 29.5% | 38.8% | 26.2% | 5.6% | 70.5% |
| Physical Science | 65.8% | 26.9% | 6.7% | 0.6% | 34.2% |
| United States History | 39.1% | 34.5% | 21.1% | 5.3% | 60.9% |
| Note: The number of students taking the EOC varies widely with only 774 students taking the Physical Science test while by comparison, 3,579 students took the Biology assessment. | |||||
Here are some positive highlights (Yay!) among the numbers:
- 12 elementary schools had at least 80 percent of students perform at or above the Developing Learner achievement level averaged across all subjects. These schools are Morris Brandon (95 percent), Warren T. Jackson (95 percent), Mary Lin (95 percent), Morningside (95 percent), Springdale Park (93 percent), Atlanta Neighborhood Charter (90 percent), Sarah Smith (89 percent), Atlanta Classical Academy (88 percent), Charles R. Drew Charter (85 percent), E. Rivers (85 percent), The Kindezi School Westlake (84 percent) and West Manor (82 percent).
- Seven middle schools had at least 80 percent of students perform at or above the Developing Learner achievement level averaged across all subjects. They are The Kindezi School Westlake (86 percent), Atlanta Classical Academy (84 percent), Inman (84 percent), KIPP STRIVE Academy (83 percent), Charles R. Drew Charter (81 percent), Atlanta Neighborhood Charter (80 percent) and KIPP WAYS Academy (80 percent).
- Five high schools had at least 80 percent of students perform at or above the Developing Learner achievement level in Ninth Grade Literature and Composition – Carver Early College (98 percent), Charles R. Drew Charter (96 percent), North Atlanta (88 percent), Grady (86 percent) and Coretta Scott King Young Women’s Leadership Academy (82 percent).
- Four high schools had at least 70 percent of students perform at or above the Developing Learner achievement level in Coordinate Algebra – Carver Early College (96 percent), Charles R. Drew Charter (73 percent), KIPP Atlanta Collegiate (72 percent) and North Atlanta (70 percent).
Much attention has been directed to our School Turnaround Strategy and our response to the proposed Opportunity School District. It is important to note these Milestones results will inform a new CCRPI (College and Career Ready Performance Index) score, which will be released in the next few months.
The release of the Georgia Milestones does, indeed, set a new baseline milestone for APS, providing our stakeholders with better information about our progress and setting the stage for collaboration that will help our students succeed. As always, this administration is fully committed to delivering a quality education so that all students are prepared for college and career.
Blog Signup