Highlighting (and Understanding) 3rd Year of GA Milestones Results
57 Schools Improve, Up 17 More than Last Year
 While our beautiful students are away for summer break, my Atlanta Public Schools colleagues and I spend these months evaluating the past school year and preparing for the school year ahead. In what is becoming a Georgia education pattern, summer seems to also now mark the official release of Georgia Milestones results. (No summer rest for the school-year weary! LOL!)
This morning, the Georgia Department of Education released the results of its third administration of the Georgia Milestones assessments based on the new Georgia Standards of Excellence. Milestones results also inform College and Career Ready Performance Index (CCRPI) scores, which will be released later this year. (I have written extensively for this blog explaining what these tests mean for Atlanta Public Schools and our results; I encourage you to click my 2015 results blog if you need a primer to make sense of these tests and the differences from previous assessments and my 2016 results blog for how APS did last year.)
 These tests sometimes come with news of hope and progress but always with indicators for improvement and renewed focus. Once again, we have both. Here goes …
For the glows: 57 – or about two-thirds – of our schools showed improvements over last year’s assessments – that’s 17 more than last year! Broken into the two main categories of assessment, that means that 50 of our schools in grades 3-8 showed overall improvements on the End-of-Grade (EOG) tests when we average the results across all subject areas. For the End-of-Course (EOC) tests administered at the high school level, 10 of our schools achieved an overall gain in their scores. Three schools – BEST Academy, Charles Drew Charter, Forrest Hill Academy – saw improvements in both the EOG and EOC. (See Tables 3 and 4 at the end of the blog for those schools!)
I am pleased with the progress, especially when two-thirds of our schools improved on their Georgia Milestones as compared to the year before. We also saw significant EOC improvements in five high school subjects with comparison data. Also, APS improved district-wide in the EOG mathematics assessments, which tested elementary and middle school students.
As a reminder, APS has made considerable strides over the past two years as part of the district’s Turnaround Strategy. Nearly all of our schools receiving targeted interventions – that is, 16 of our lowest-performing schools with the deepest supports with school programming changes, operating partners and/or additional resources – saw gains across all subject areas.
That’s encouraging news as we go into the 2017-2018 school year and inspires us to push those scores even higher!
And now for some of the flows (as in charts – assessment humor – womp womp!): We can expand the scores even further as shown on the following tables. To understand the charts, note that Georgia Milestones Assessments measure student performance using four levels: Beginning Learner, Developing Learner, Proficient Learner, and Distinguished Learner. Each level provides information based on student mastery of content standards.
On the EOG tests, the district percentages of students scoring Developing and Above ranged from 51.7% in Science to 65.2% in Mathematics.
Table 1: APS 2016-2017 Milestones EOG Results, Average of Grades 3-8
| Subject | Beginning Learner | Developing Learner | Proficient Learner | Distinguished Learner | Developing and Above |
| ELA | 38.5% | 29.5% | 23.1% | 8.8% | 61.5% |
| Mathematics | 34.8% | 35.5% | 20.8% | 8.9% | 65.2% |
| Science | 48.3% | 24.6% | 20.0% | 7.1% | 51.7% |
| Social Studies | 37.2% | 37.4% | 17.3% | 8.1% | 62.8% |
On the EOC tests, Ninth Grade Literature & Composition had the highest overall achievement levels with 74.4%, followed by American Literature & Composition at 70.5%.
Table 2: APS 2016-2017 Georgia Milestones EOC Results by Subject
| Subject | Beginning Learner | Developing Learner | Proficient Learner | Distinguished Learner | Developing and Above |
| Algebra I | 53.5% | 28.5% | 12.9% | 5.2% | 46.5% |
| American Literature & Composition | 29.5% | 35.1% | 26.2% | 9.3% | 70.5% |
| Biology | 45.6% | 24.5% | 23.4% | 6.6% | 54.4% |
| Economics/Business/Free Enterprise | 37.2% | 30.9% | 27.1% | 4.9% | 62.8% |
| Geometry | 41.8% | 33.7% | 16.6% | 8.0% | 58.2% |
| Ninth Grade Literature & Composition | 25.6% | 36.1% | 31.9% | 6.4% | 74.4% |
| Physical Science | 62.1% | 22.6% | 11.7% | 3.6% | 37.9% |
| United States History | 36.8% | 33.4% | 22.6% | 7.2% | 63.2% |
Here are some positive highlights among the numbers:
- Fourteen schools had at least 75% of students perform at or above the Developing Learner level averaged across all subjects in elementary grades. These schools are Warren T. Jackson (96.3%), Mary Lin (95.3%), Morris Brandon (94.4%), Springdale Park (93.1%), Morningside (92.6%), Atlanta Classical Academy (91.7%), Charles R. Drew Charter (90.4%), Atlanta Neighborhood Charter (88.2%), Sarah Smith (85.7%), West Manor (81.4%), Burgess-Peterson (81.1%), E. Rivers (79.3%), Garden Hills (78.0%) and Wesley International (77.3%).
- Seven schools had at least 75% of students perform at or above the Developing Learner level averaged across all subjects in middle school grades. They are Atlanta Classical Academy (91.5%), Atlanta Neighborhood Charter (85.4%), Inman (84.8%), Charles R. Drew Charter (81.3%), Sutton Middle (80.0%), KIPP STRIVE (76.6%) and KIPP WAYS Academy (75.8%).
- Six high schools had at least 75% of students perform at or above the Developing Learner level in American Literature & Composition. They are North Atlanta (88.7%), Grady (88.6%), Charles R. Drew Charter (87.8%), KIPP Atlanta Collegiate (79.1%), Coretta Scott King (78.4%) and Maynard H. Jackson (78.2%).
- Seven high schools had at least 75% of students perform at or above the Developing Learner level in Ninth Grade Literature & Composition. They are Atlanta Classical Academy (98.1%), Grady (90.8%), Charles R. Drew Charter (90.7%), North Atlanta (88.2%), KIPP Atlanta Collegiate (84.4%), Maynard H. Jackson (83.8%) and Carver Early College (83.5%).
- Five high schools had at least 75% of students perform at or above the Developing Learner level in U.S. History. They are Grady (80.3%), KIPP Atlanta Collegiate (77.6%), North Atlanta (76.7%), Carver Early College (76.1%), Charles R. Drew Charter (75.0%).
I’m so proud of the schools above and the achievement levels they are meeting! Please see our press release, and visit our Georgia Milestones results page and my Twitter feed @CarstarphenMJ for more information.
As we continue the Journey of Transformation of Atlanta Public Schools, it is imperative that we continue to improve student outcomes over time. We must make greater progress. As I wrote earlier in this blog, Georgia Milestones is one guide to help districts determine our needs and areas of focus for academics.
For the grows, we have seen a decline in English Language Arts (ELA) in the elementary grades, meaning many of our students are not reading on grade level. To that end, APS has targeted literacy as a district priority for the future.
This summer, we made a big play in literacy thanks to a multi-million-dollar grant from the Chick-Fil-A Peach Bowl Inc. and the College Football Playoff Foundation. With that grant, we have implemented a district-wide training program for all kindergarten through fifth-grade teachers over a two- to three-year period. APS will oversee the use of the Orton-Gillingham approach to reading instruction that focuses on teaching kids to read at the word level, make connections between sounds and letters and develop language skills. Training for 175 teachers began this summer; by 2020, this initiative will equip 1,500 APS teachers with the skills to more effectively teach reading to our students.
Other grants and initiatives for literacy are in the works, so stay tuned!
But we are working hard across the curriculum – not just with reading – to meet the state’s more rigorous and demanding standards. And that will be more difficult with fewer resources in the upcoming school year.
While we have every intention of continuing this work along a strategy that has shown results, an unexpected fiscal challenge recently surfaced around our budget as it relates to tax assessments as I’ve written about on this blog before. With the Fulton County Commission voting to freeze residential property tax assessments at FY2016 levels, the district is preparing to lose up to $12 million in tax revenue and that has reduced our budget resulting in program cuts and furlough days for staff and preventing the implementation of the state’s increase to teachers’ base salary scale.
To date, we still don’t know the exact details of the Fulton County tax digest, especially in commercial and new construction; therefore, we will not be able to assume growth levels will be enough to reinstate the aforementioned reductions. As our results show, it requires an investment to turn our lowest-performing schools around, which is now in jeopardy.
Despite that possible setback, we will continue to be committed to supporting our teachers and schools with the resources we have so that they can try to deliver quality instruction. Our mission remains to graduate all students ready for college and career.
Finally, I know it has been hard on school communities that have experienced targeted interventions such as consolidations, new operating partners and big changes in programming and staffing, and I thank them for their thought partnership, critical feedback and ideas that helped refine our strategies over these past three years.
I want to also thank my colleagues – our leaders, teachers and support staff – for their patience, flexibility and support throughout the turnaround, as well as our partners for their expertise, guidance and resources and our parents and caregivers for their loyalty and trust.
All of the work required support from the Atlanta Board of Education, and I appreciate the members for their commitment to the district.
Most of all, I thank the students for their hard work and preparation that led to these gains.
We achieved this progress TOGETHER!
~APPENDIX~
Table 3: Schools seeing gains in the percentage of students scoring at or above the Developing Learner level across all subjects for grades 3-8 End-of-Grade tests
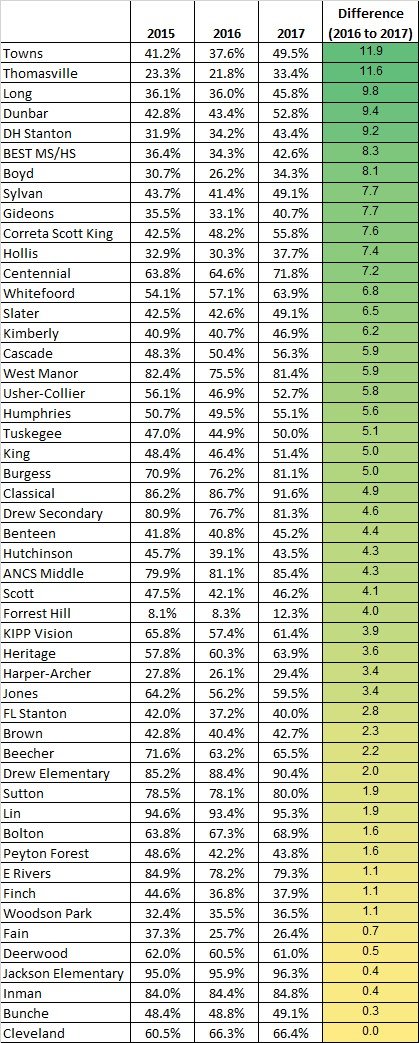
Table 4: Schools seeing gains in the percentage of students scoring at or above the Developing Learner level across all subjects for End-of-Course tests

Table 5: APS Year-over-Year Milestones EOG Comparisons, Developing and Above
| Subject | 2015 | 2016 | 2017 | Difference 2016 to 2017 |
| ELA | 61.6% | 62.5% | 61.5% | -1.1 |
| Mathematics | 63.9% | 62.4% | 65.2% | 2.8 |
| Science | 51.7% | 52.7% | 51.7% | -1.0 |
| Social Studies | 61.8% | 62.4% | 62.8% | 0.4 |
Table 6: APS Year-over-Year Milestones EOC Comparisons, Developing and Above
| 2015 | 2016 | 2017 | Difference 2016 to 2017 | |
| Algebra I | N/A | 52.7% | 46.5% | -6.2 |
| American Literature & Composition | 69.3% | 65.1% | 70.5% | 5.4 |
| Biology | 46.0% | 52.4% | 54.4% | 2.0 |
| Economics/Business/Free Enterprise | 59.3% | 57.0% | 62.8% | 5.8 |
| Geometry | N/A | N/A | 58.2% | N/A |
| Ninth Grade Literature & Composition | 70.5% | 63.4% | 74.4% | 11.1 |
| Physical Science | 34.2% | 31.3% | 37.9% | 6.6 |
| United States History | 60.9% | 64.2% | 63.2% | -0.9 |
Blog Signup