2018 ACT and SAT Scores Are In!
Number of APS Students Taking the ACT and SAT Continues to Increase

2018 Graduates from Grady High School
We received the 2018 ACT and SAT results, showing that our 2018 graduating class had an average total SAT score of 997 and an average composite ACT score of 18.7. This year’s SAT scores are up five (5) points compared to the 2017 average score of 992, and the ACT results show a slight decrease of 0.3 points over last year.
I continue to be encouraged by the academic gains our students are making across a number of academic performance measures, and we’re seeing a slight improvement on SAT scores since last year. Although there was a 0.3 point decline on the ACT, we’re still seeing gains across subgroups since 2014.
And, now for the shout outs!
I have to send a special shout out to our very own Grady High School, which topped all APS high schools in ACT and SAT results! I’m so proud of the progress Principal Bockman and the Grady Knights are making! Go Knights!
But, I would be remiss if I didn’t give some shine to Drew Charter and North Atlanta High School because they scored higher than the average total SAT score for Georgia and the Nation! Woohoo!
The average total SAT score for the nation is 1,049, and the average total score for Georgia is 1,054. Way to soar Principal McKnight and the Drew Eagles! In addition, way to go Principal Douglass and the NAHS Warriors!
Overall, I’m pleased that the number of APS graduates taking the ACT and SAT has been steadily increasing over the past four years. We had an additional 250 students take the SAT in 2018 for a total of 1,382 and an additional 52 graduates take the ACT for a total of 1,753 when compared to the number of test takers in 2017.
Here are a few highlights from the SAT data…
The five-point increase in the average total SAT score is split between gains on the evidence-based reading and writing (ERW) and math sections. African American students – the largest subgroup in APS – had an average total SAT score of 948 (up from 946 for 2017 graduates). This is higher than the national average of 935 but slightly below the state average of 961. In addition, African-American students had an average composite ACT score of 17.3, which is slightly below the state average of 18.0 but above the national average of 16.9.
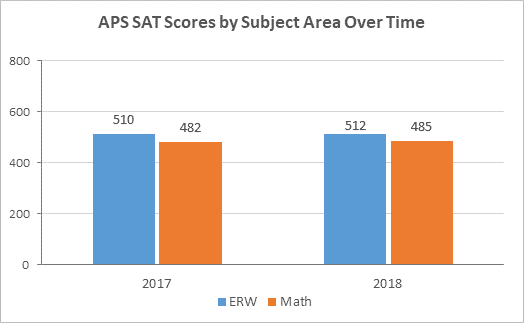
Figure 1. APS SAT Scores by Subject Area Over Time
Some 29% of APS SAT test takers met both the ERW and math benchmarks for college and career readiness (score of 480 or higher on the ERW section and 530 or higher on the math section). In addition, 60% of students met the ERW benchmark and 31% met the math benchmark. The percentage of students meeting the math benchmark increased slightly from 2017 (30%) to 2018, while the percentage of students meeting both benchmarks remained at 29%.
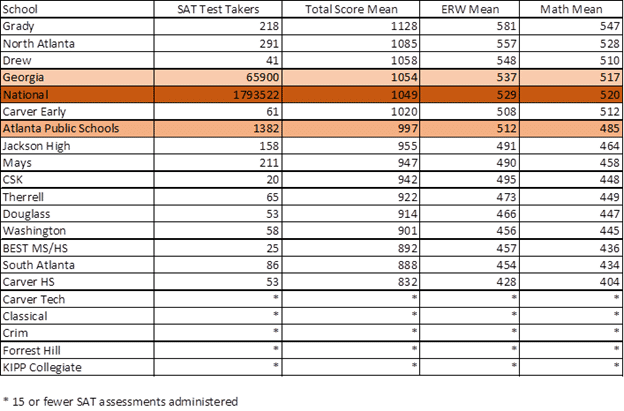
Figure 2. SAT Results for 2018 Graduates by School
One of our biggest accomplishments last year was the implementation of our first SAT Day, sponsored by Achieve Atlanta, which allowed all juniors to take the SAT exam at their home school, removing funding and transportation barriers for many students. Please note, juniors are NOT in these data. Maybe next year’s 2019 SAT data will include significantly more student taking the test who otherwise may not have sat for the exam previously. However, our 2019 SAT average scores are likely to decline because of this increase, but we know that something as simple as not taking the SAT in high school can be a barrier for kids who, down the road, decide that they want to attend college.
Now, on to the ACT…
The percentages of ACT test takers meeting the college readiness benchmark scores were higher in English (42%) and reading (30%) than in math (22%) and science (20%). Some 14% of test takers met the benchmarks in all four subject areas and 21% of test takers met the benchmarks in at least three of four subject areas. All of these percentages represent increases since 2014.
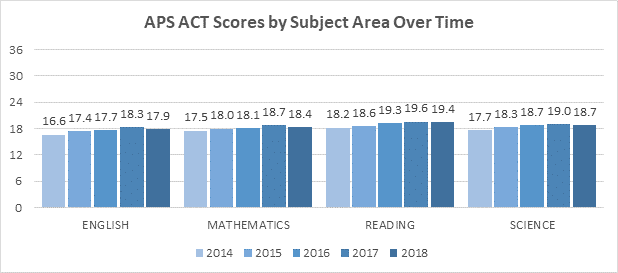
Figure 3. APS ACT Scores by Subject Area Over Time
And, here’s a breakdown of our school scores on the ACT:

Figure 4. APS ACT Results for 2018 Graduates by School
Monitoring and continuing to improve the results on the SAT and ACT are essential for increasing rigor and addressing equity and access to achieve our mission of college readiness for all students.
Thank you to our Class of 2018, high school principals, teachers, counselors, and our key partners – Achieve Atlanta, College and Career Academy, and One Goal – just to name a few, for all that you do!
Blog Signup